Using the enhance buttons
indicated in the image below, first click on the linear stretch button ![]() .
.

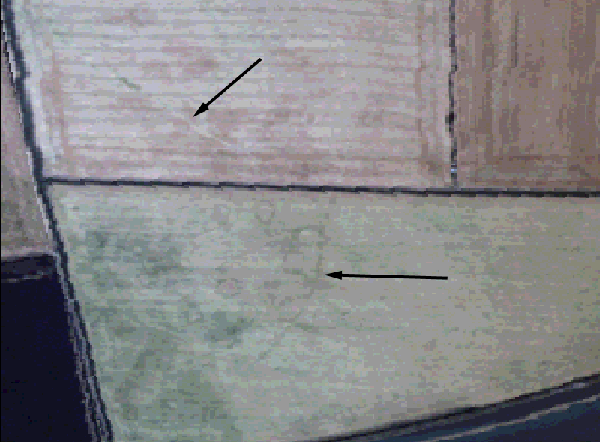
You should now have an image looking something like the one below. The arrows indicate areas of potential archaeological significance

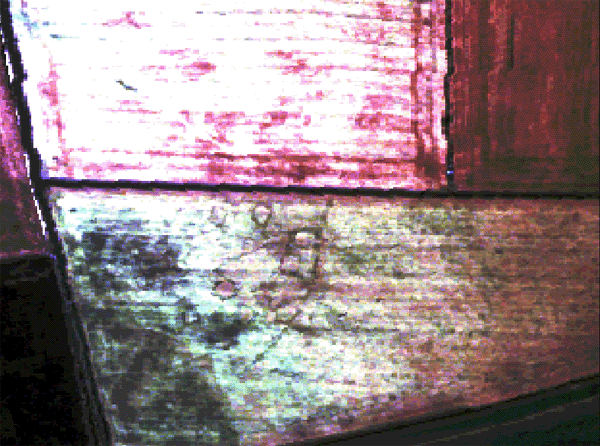
Now click on the histogram equalise
button ![]() . The features in the bottom field are now much clearer, although
the linear feature in the top field has become less visible.
. The features in the bottom field are now much clearer, although
the linear feature in the top field has become less visible.

You
can play around with the values that the non-linear equalisation has
chosen by returning to the raster source dialogue (the one you used to
change the band combinations). This allows you to manually use the
sliders on each of the three bands to make more subtle enhancements to
the image. To return to a non enhanced view of the data simply click on
the revert to no enhancement button ![]() .
We now want to move beyond the visible
wavelengths.
.
We now want to move beyond the visible
wavelengths.