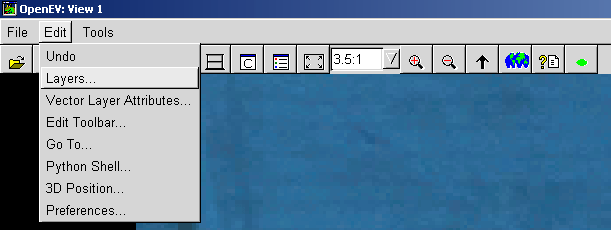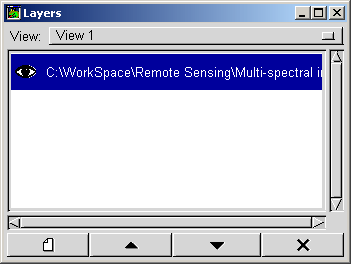

The rather bland image you are now looking at has hidden depths, but first you need to know what you are looking at. This multi-spectral image is composed of 12 different bands, and Open_EV has defaulted to combining bands 1, 2 and 3 as RGB (red/green/blue) values. These are the blue, blue-green and green bands, which in this case do not contain a great deal of archaeological information. We need to display a different combination of bands. To do this, click on the Edit/ Layers submenu (see below), which should bring up the layers dialogue. Right click on the image name (next to the slightly Egyptian looking eye, see below) and


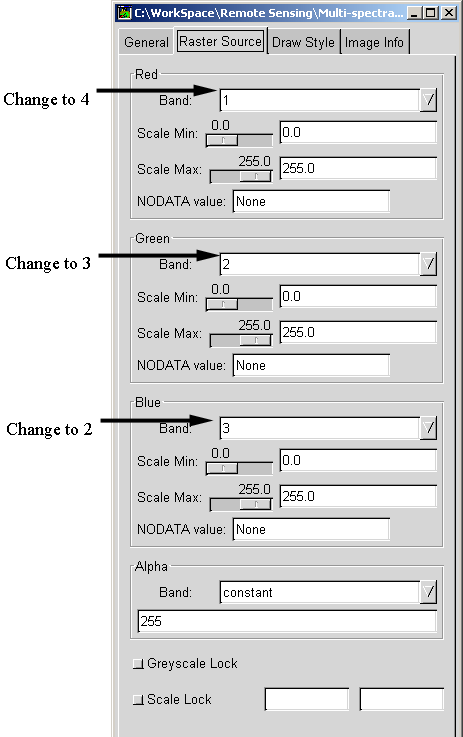
a new dialogue will appear (see below). Click on the Raster Source menu. Right click in the Band areas (indicated by the arrows in the diagram). Change the numbers to 4, 3 and 2 respectively, which will give a "normal colour" look to the image, although it is not quite what the human eye would see.

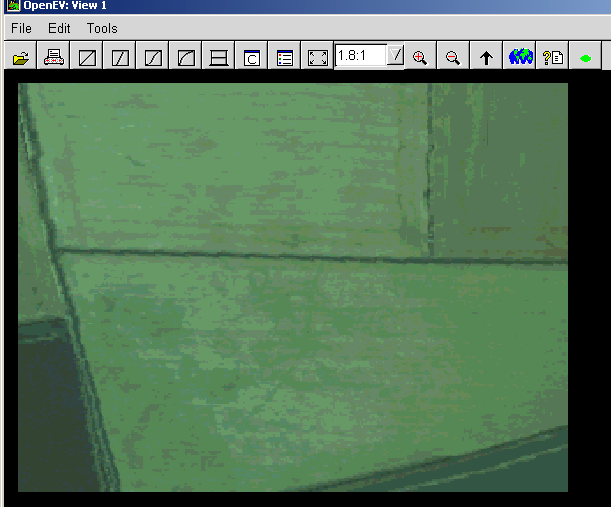
You should now see something like the image below on screen. Now its time to extract something more meaningful from this data source.
